The Ideal Small Cap Value ETF – $DFSV or $IJS?

As an introduction to the Verified Beta approach and methodology, and in service of identifying the ideal small cap value ETF, let’s compare IJS (BackRock’s iShares S&P Small-Cap 600 Value ETF) against DFSVX (DFA’s U.S. Small Cap Value Portfolio Institutional Class Mutual Fund). We start the analysis period at the launch of IJS in mid-2000 (DFSVX was launched 7 years earlier as a pioneering fund in the factor investing space). DFA recently launched the DFSV ETF as DFSVX’s identical twin in a tax-efficient ETF wrapper. Thus, we can use the historical performance of DFSXV as a direct proxy for the expected factor exposure of DFSV.

Stepping back, it’s worth considering how a superior small-cap value fund fits into an optimally-diversified (nominally mean-variance optimized) factor-based ETF portfolio. Once it’s clear that diversified exposure to Small, Value 1 contribute to superior risk-adjusted fund returns, we need a consistent analytical framework to assess the net factor capture of these funds in order to identify the best of the bunch. 2

Ignoring for the moment the benefits of alternate vectors of diversification such as geographic or asset class (fixed income, liquid alts, real estate, etc), let’s assume that pure publicly-traded equity risk premia diversification is best realized with roughly equal-weight allocations to the 3 horsemen of Value, Quality, and Momentum 3. This approach is supported by the fact that, net of turnover-driven transaction costs, each of these risk premia sports approximately equal annualized historical return coupled with reasonably low cross-factor correlation. With lower ex-post risk adjusted returns, the Small premium might be expected to contribute less, and is not a fantastic historical diversifier (as it’s 0.28 correlated with market beta for reasons well articulated in AQR’s research covering small cap’s lack of liquidity). Small does recover credibility and expected return when combined with Quality, and so we make Quality factor exposure a gating criteria for any candidate Small Value fund (Small when bogged down by junk really is junk). In an ideally-diversified multi-factor portfolio, market beta receives about the same weighting as Value, Profitability, and Momentum. 4 This isn’t realizable when restricted to long-only ETF allocations, however, as we cannot avoid roughly 1.0 units of market beta for each 0.2 to 0.5 units of exposure to each of Small, Value, or Quality in a long-only fund. We’ll contemplate the benefits and expected risk-adjusted returns of dialing down market beta exposure with a simple and efficient short in a future article.

In sum, we’re hunting for a small-cap value sleeve with proven exposure to Value, and Small + Quality (proxied by the combination of RMW and CMA in the case of the Fama-French 5-factor model + Momentum, which we refer to here as FF6). Let’s take a look at how these two funds stack up in factor regressions, normalizing for risk-adjusted returns net of implementation costs and fees (we highlight only statistically-significant factors):

$IJS

85%

Small
SMB5 94.7%
Value
HML 85.6%
Profitability
RMW 56.5%
Investment
CMA
Momentum
CMA

$DFSVX

91%

Small
SMB5 97.2%
Value
HML 100%
Profitability
RMW 29.5%
Investment
CMA 35.9%
Momentum
CMA

Where the Numbers Come From

We take the current universe of 3000+ US-listed ETFs and filter for those that have been around for least 2 years, leaving ~2200 funds. This is consistent with the launch pace of ~400 funds per year in each of 2021 and 2022. We regress all funds’ 24+ month total-return data on the FF6 factors (FF5 + UMD). Based on those results, we impose the following additional filter criteria:

Criteria Lower Bound Upper Bound
Implied Relative Factor Sharp 1.0 N/A
Market Beta Coefficient 0.8 1.2
AUM $50M N/A
Fund Lifetime 10 years N/A
Annualized Dividend Yield 0.5% N/A

Implied Relative Factor Sharpe is the ratio between the ex-post Sharpe ratio of a synthetic fund with factor loadings equal to those derived in the regression, including alpha (the regression intercept), divided by the market Sharpe ratio, both over the full period of Kenneth French’s factor data starting in July of 1963 (nearly 60 years of data). As expected, alpha is nearly always negative and equates to trading costs plus management fees. We submit that Relative Factor Sharpe is the ultimate acid test of fund viability; regardless of a fund’s performance over the analysis period, if it would not have generated a superior risk-adjusted return over the full history of factor data under ideal conditions, then it has no rational place in a portfolio. 5

Here’s a somewhat shocking-fact that speaks to the cost and inefficiency of implementing factors in long-only funds: when we filter our ~2200 fund analysis universe down to those that have a positive Relative Factor Sharpe, we are left with just 170 funds. Once we impose our 10 year lifetime restriction, the list drops to just 70 funds. 56% of all funds have statistically-significant (t-stat > 1.96) exposure to at least one of the FF6 factors, and can reasonably be identified as ‘smart-beta’. Of these, just 19% justify their existence, net of negative alpha (implied fees and transaction costs). That means 81% of all ‘smart-beta’ funds leave the investor worse off than a simple low-fee cap-weighted total-market passive fund like IVT. Surfacing the best of this short list of funds is the essential mandate of our efforts, here.

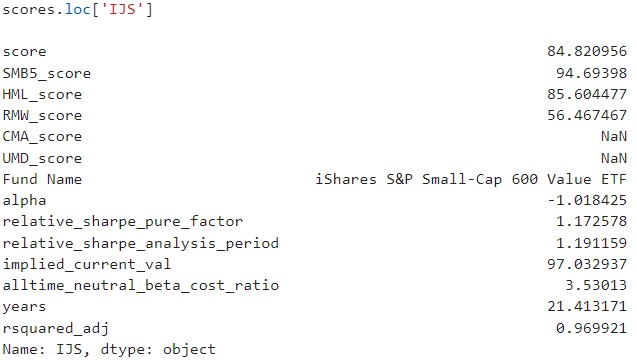
Back to IJS versus DFSVX: IJS earns an overall score of 85%. Mathematically, it has a Relative Factor Sharpe of 1.17 (17% better than the plain-vanilla market over the analysis period). See the figure below for further stats; Relative Factor Sharpe is identified as ‘relative_sharpe_pure_factor‘ in the analysis output. This means that IJS has a Relative Factor Sharpe equal to 85% of the 95th percentile fund in the analysis. In this case, the 95% percentile fund has a Relative Factor Sharpe of 1.38 (1.17 / 1.38 = 85%). (Several funds fall into the 95% percentile or better, and we’ll discuss other attractive candidates and their factor capture in future posts). At 91%, DFSVX has a Relative Factor Sharpe of 1.26, 26% percent better than the market, and 7.7% better than IJS, making DFSVX the superior choice on a risk-adjusted basis, ex-ante, if we take ex-post synthetic returns and factor capture as our best predictor of forward fund returns. 6

We also include two ‘Factor Waterfall Charts’ for direct comparison between the two funds’ factor return contributions over the ~21 year analysis period (charts are interactive, so feel free to zoom and pan). DFSVX picks up 20bps with a slightly-greater market beta (we could have volatility-normalized to equal market betas), 10bps in SMB, 20bps in HML, 40bps in RMW, -20bps in CMA, and a further 50bps in residual Alpha, for a total of ~70bps of outperformance. DFSVX is 7% more volatile than IJS over the analysis period, and delivers almost exactly 7% greater absolute performance (this margin is larger if we use returns in excess of the risk-free rate); Sharpe ratios are therefore similar over the analysis period. DFSVX comes out on top because of its historical factor mix which drives the superior Relative Factor Sharpe measure (see above).

For those interested, here’s a quick run down of the other key metrics in the analysis. The various factor scores in the bar charts, above, are their % of the value of the 95% percentile fund ranked separately on the individual factors. DFSVX’s score of 100 in HML, for example, means that its HML factor exposure is at least greater than the 95th percentile fund among those with statistically-significant HML exposure. ‘alpha‘ is the annualized fund implementation cost, ‘implied_current_val‘ is the ratio between the current dividend yield, and the average historical dividend yield (stated in %) as a somewhat crude proxy for current valuation, and ‘alltime_neutral_beta_cost_ratio‘ is the ratio of implementation costs to the expected smart factor beta, net of market beta. In other words, it’s the return on implementation drag; IJS has a 3.5X ratio, which means that for every 100bps of fees and implementation costs, 350bps of expected smart factor beta is delivered in return; clearly the bigger the better, with ratios under 1.0 defining a fund that is not justifying its existence (even without adjusting for volatility, as is accounted for with the Relative Factor Sharpe measure).

It’s natural to ask: which other Small Value funds rank in the 95th percentile with scores of 100 and are among the relatively few funds that justify their existence as smart beta? We’ll cover those in upcoming reviews.

Additional Analysis Stats
  1. defined as B/P, or any statistically-superior composite measure of value, such as of P/S combined with P/CFO), and let's say Quality (again, typically a composite of various profitability and first-derivative growth measures)
  2. We capitalize the primary well-established factors for easy identification, but without necessarily implying a specific constitution methodology: Small, Value, Quality, and Momentum, Profitability and Investment. The q5 model also includes Expected Growth.
  3. see How Inefficient is the 1/N Strategy for a Factor Investor? for more on this
  4. Recognizing that a pure momentum strategy typically demands 100%+ annualized turnover and therefore struggles to capture positive expected returns net of trading costs, DFA aim for the best of both worlds by adding a momentum screen to their regular rebalancing process. DFA's Wes Crill expounds on this and the firm's overall thoughts in a piece published in the summer of 2018. DFSVX has a small and statistically-insignificant exposure to Momentum since mid-2018, but we can be confident their backtests suggest this approach delivers positive alpha. Fund alpha itself has been positive 66bps annualized at a statistically-insignificant level over the same 55 month period. In fact, DFSVX has outperformed IJS by 182bps annually over the same period, almost entirely reflected in alpha unexplained by the FF6 model used in this analysis.
  5. Unless, for some unexplained reason, we would expect ex ante factor performance to exceed historical values. For a recently-beleagured factor like Value, this may be worth considering. We could also (somewhat arbitrarily) back out the recent underperformance of Value to adjust for this, but then we'd be playing games with numbers. Regardless, over the ~60 year dataset, Value remains one of the best-performing factors net of implementation costs, even considering its recent protracted period of underperformance.
  6. DFA's academic pedigree and ongoing re-assessment of optimal factor harvesting ought to pay off in long-term factor capture and positive expected alpha; a fund like BlackRock's IJS has a fully-transparent (and therefore non-proprietary) implementation methodology but is comparatively simple.

Leave a Reply

Your email address will not be published. Required fields are marked *